The BCG’s Growth Share Matrix
Concept utility.
The purpose of the Growth Share Matrix is to help a company allocate resources to its different business units or product lines most effectively.
History.
The real name of the concept is the Boston Consulting Group’s (BCG’s) Product Portfolio but it is mostly known as the BCG Growth Share Matrix. This concept was developed by Bruce D Henderson, the Founder of BCG and HBS graduate. In the words of Bruce D Henderson himself, “To be successful, a company should have a portfolio of products with different growth rates and different market shares. The portfolio composition is a function of the balance between cash flows.” This is what the matrix helps businesses do.
Explanation.
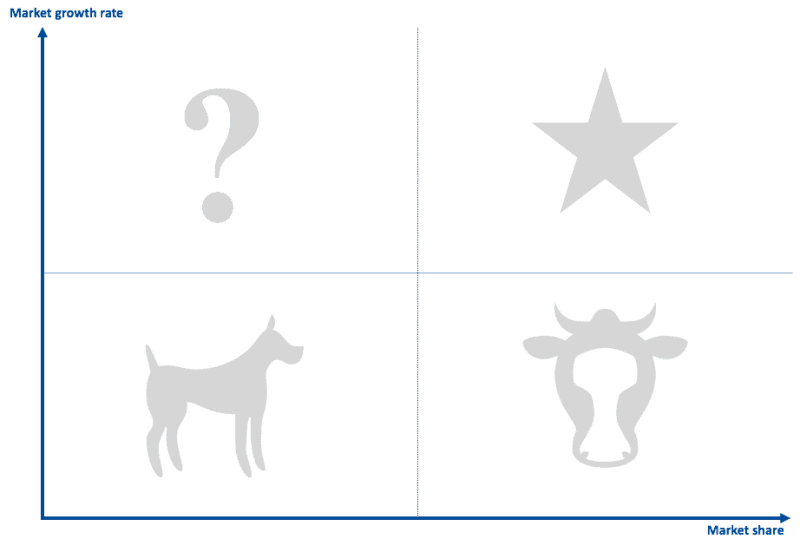
The basic concept is that the chart works by plotting business units (or products) on a scatter graph relative to the basis of their market shares and growth rates. There are four quadrants each of which represents a different type of business unit. These unit types are:
 Cash cows are business units where the company has high market share in a slow-growing industry. The beauty of these units is that they should be self-sustaining in terms of cash flow and require little if any investment. In fact investment in this type of business unit is discouraged by BCG Growth Share Matrix analysis because it would be investing in a mature market with very little room for improvement. [separator top=”20″]
 Dogs are units with low market share in a slow-growing industry. These units typically struggle to generate enough cash to maintain the business’s market share. In BCG analysis, dogs should be divested in order to free up cash flow for more profitable investments.[separator top=”20″]
 Question Marks are business operating in a high market growth industry, but with a low market share. Question marks must be carefully scrutinized in order to judge whether they will become Dogs or Stars and whether or not on that basis they require further investment to develop their market share.[separator top=”20″]
 Stars are units with a high market share in a rapidly-growing sector. Stars should generate plenty of cash but may at the same time require significant cash injections in order to keep pace with and exploit the growth potential of the market.[separator top=”20″]
This is a basic summary of the key analytical uses of the BCG Growth Share Matrix as well as illustrating the appropriate strategic responses to the analysis.
Take out.
I can’t think of a more punchy way of capturing the key message of this concept other than by again quoting from the famous founder of BCG, Bruce D Henderson himself. “High growth products require cash inputs to grow. Low growth products should generate excess cash. Both kinds are needed simultaneously.“
Download.
Download the eloquens template slide from our Marketplace in order to help you map your business units and be able to reflect on your strategy from this mapping.
Download here the template Eloquens bcg matrix made by the Eloquens Team
–


Leave a Reply
Want to join the discussion?Feel free to contribute!